
Investment Manager Powered by an Artificial Machine
Value StocksLogin
Value Investing Stocks

Looking for the Best Value Investing Stocks? Not Every Stock That Dropped Is Undervalued.

Many value stock picks are chosen because the price fell. IM-AAM looks for the fair value gap: stocks priced below even the lowest estimate of their fair value range, then checks the trend before suggesting an entry.

Sign Up FreeLogin

Free account: see every stock name. Pay only for the stocks you unlock.

Continue As Guest →
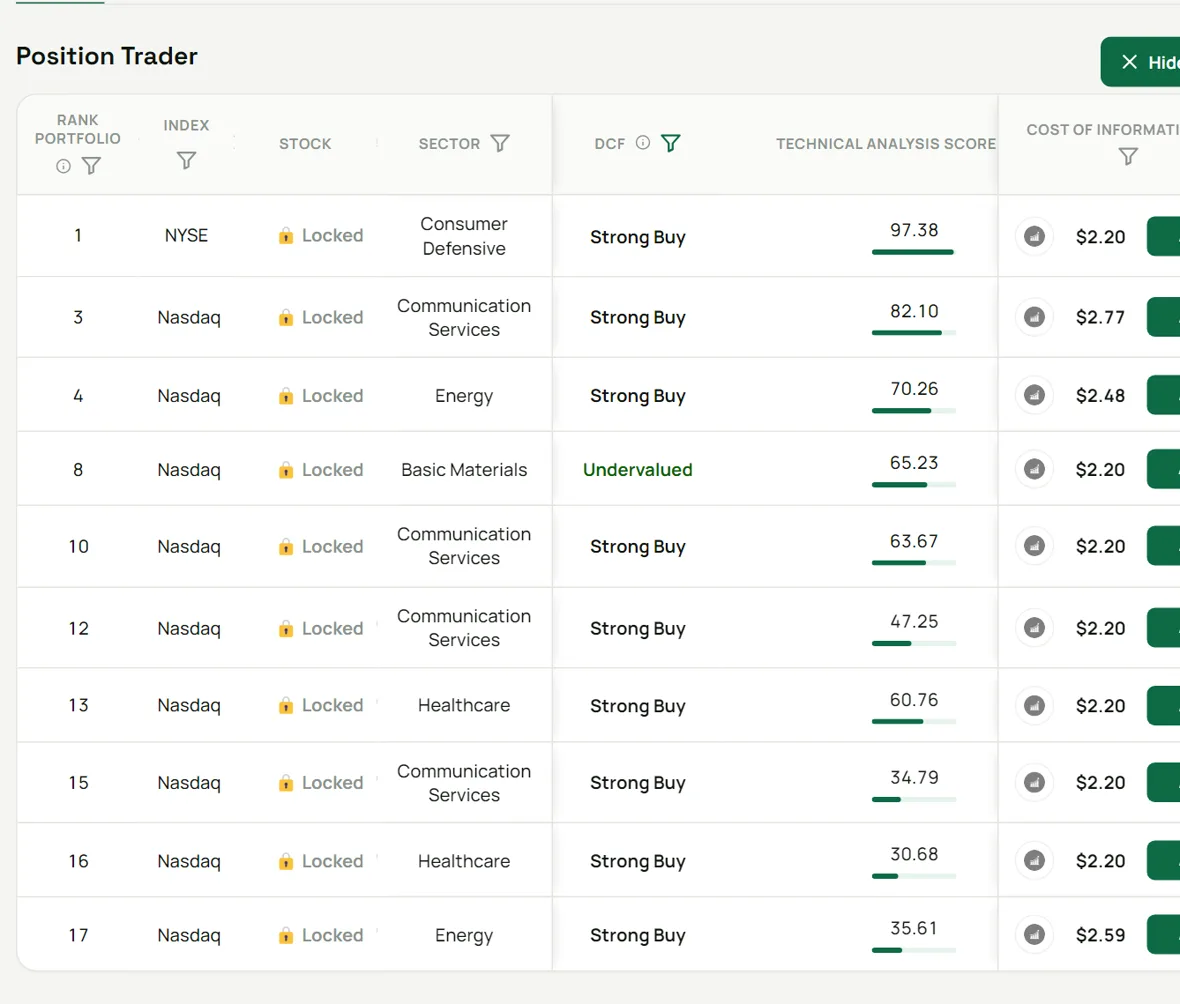
IM-AAM Long-Term list filtered by the Undervalued and Strong Buy DCF labels

Undervalued US Stocks Today

Stocks on our Position list with an Undervalued or Strong Buy DCF label, ranked by our AI model.

Log in to see the stock names.

RankStockPriceDCF labelTarget price
1Locked$50–$100Strong Buy$84.19Log in to see it
4Locked$30–$50Strong Buy$32.21Log in to see it
5Locked$20–$30Strong Buy$23.06Log in to see it
6Locked$20–$30Strong Buy$28.47Log in to see it
8Locked$10–$20Strong Buy$18.10Log in to see it

Many stock-pick sites pick a stock just because its price fell. Why those picks are riskier →

A Risky Pick vs. a Fair Value Gap

Two stocks, two very different places for the price to be.

The risky pick

Price inside the fair value range

CDE · Coeur Mining · NYSE

Fair value $10.00–$16.00Price $13.45
Price (2-year change)
$13.45 (+89%)
Example fair value range
$10.00 – $16.00
Margin of safety
None: price inside the range

After a run of almost 90% in two years, the price sits inside its fair value range and well above the low end. Buying here leaves no margin of safety: if the price falls back toward fair value, you lose money.

A fair value gap

Price below the fair value range

PYPL · PayPal · NASDAQ

Fair value $79.00–$93.00Price $57.02
Price (2-year change)
$57.02 (−30%)
Example fair value range
$79.00 – $93.00
Margin of safety
28% – 39% below the range
Upside to the range
+39% – +63%

Here the price is below even the lowest estimate. That gap is the margin of safety: room for the estimate to be wrong, or for the market to fall, before the price is above fair value.

Illustrative example using public prices from late October 2026 and example fair value ranges. Not a recommendation and not a list of IM-AAM picks. A stock below its fair value can stay there or fall further.

How the fair value gap works →

Other Stock Pick Sites vs IM-AAM: The Fair Value Gap

Most stock-pick websites and apps call a stock a “buy” because its price just dropped, which makes many of their picks riskier. IM-AAM checks the question they skip with a scientific financial model: is the price below what the business is estimated to be worth?

Other sites’ pick: riskierFair value range: below the priceSupportPrice after the dropStill abovefair value
Step 1 of 5

Other sites: “The price dropped, so buy”

Many stock-pick websites and apps, free or paid, flag a stock as a buy because its price fell to a support line. But here the fair value range sits below the price: you would still be buying high. That makes the pick riskier, with little room left to rise and more room to fall.

Illustration only, not a real stock or price. No method guarantees what a price will do next. How the fair value gap works →

No subscription: you pay per stock you unlock, and see the price before you add it. See how our pricing works →

Watch: 3 Big Stock Market Mistakes to Avoid

A short video from the IM-AAM team on the mistakes that cost investors the most.

Why Finding Undervalued Stocks Is Hard

Free lists that go stale

Free “undervalued stocks to buy now” articles on other websites are written on one day. By the time you read them, prices and valuations have moved.

Valuation tools cost a lot

Fair-value and DCF research tools usually charge a yearly subscription, from about $131 to $549.

A price drop isn’t a discount

Many stock-pick sites call a stock undervalued just because its price fell. That makes their picks riskier: a low price says nothing about value until you compare it with what the business is worth.

How IM-AAM Helps

A DCF label on every stock

An AI discounted cash flow model labels each stock from Strong Buy to Highly Overvalued, so price versus value is visible at a glance.

Undervalued in one click

Click Apply Filters and pick Undervalued in the DCF column to keep only the stocks the model labels as undervalued.

No subscription

Pay only for the stocks you want to unlock. Each stock’s Cost of Information is shown before you add it.

IM-AAM vs a Typical Valuation Research Tool

Typical valuation toolIM-AAM
How you payYearly subscription, about $131–$549No subscription: pay per stock you unlock
Find undervalued stocksBuild or run a screenerOne filter on the DCF column
ValuationFair-value models, varies by toolAI DCF label and fair value range per stock
Also on each stockVaries by toolAI target price, technical and fundamental scores

Subscription prices are the list prices of popular US valuation research tools, checked October 2026, and can change. Why picks from other stock pick sites are riskier →

See Which Stocks Look Undervalued Now

Open the list and filter it to Undervalued, or create a free account to unlock stocks.

What You Get

Fair Value Range on Every Stock

Each stock’s chart shows its DCF fair value range, from the lowest to the highest estimate.

Below the Lowest Estimate

The DCF label marks stocks priced below their estimated value, from Strong Buy to Highly Overvalued.

Trend and Support on the Chart

A trend channel shows support and resistance, so you can see where the price sits in its trend.

A Target at Fair Value

Each stock comes with a target selling price and target profit that you can adjust.

How It Works

1
Open the Long-Term Picks list

Register or continue as a guest, then open Long-Term Picks in the menu.

2
Filter by the DCF column

Click Apply Filters and pick Strong Buy and Undervalued in the DCF column.

3
Open the stock’s chart

See the fair value range, the trend channel and where the price sits today.

4
Set your target and decide

Check the target selling price and the scores, verify the numbers, and place any trade with your own broker.

Frequently Asked Questions

What is a fair value gap?

It is the space between a stock’s price and the lowest estimate of its fair value range. A stock priced below that lowest estimate has a fair value gap.

How does IM-AAM estimate fair value?

A discounted cash flow (DCF) model estimates what each business may be worth from its expected future cash flows. The result is shown as a range, from the lowest to the highest estimate, on the stock’s chart.

Why isn’t a stock that dropped always a good buy?

A lower price can still be above what the business is estimated to be worth. Then there is little room to rise and more room to fall. That is why we compare the price with the fair value range, not only with its recent high.

Will a stock below its fair value always go up?

No. A stock can stay below its estimated value for a long time, or fall further. The estimate depends on assumptions and is not a promise about the price.

Is this financial advice?

No. IM-AAM provides AI-generated stock recommendations and research for informational purposes only. They are general information and not personalized investment advice, and you place any trades with your own broker.

IM-AAM provides AI-generated stock recommendations and research for informational purposes only. They do not constitute personalized financial advice. Access to individual stock information is priced per stock (see the pricing disclosure below). Trading involves risk, and past performance is not indicative of future results. IM-AAM is not a registered investment adviser or broker-dealer, does not hold funds and does not execute trades; you place any trades with your own broker.

Check our pricing disclosure